|
Major Turning Points in The Settlement & Populating of Australia
The first of Australia's people are assumed to have arrived there by boat from South East Asia during or after the last Ice Age. Before the first British settlement in the late 18th century, Australia was inhabited by indigenous Australians. At the time of European discovery and settlement, up to one million Aboriginal people lived throughout Australia as hunters and gatherers. They were dispersed in around 300 clans and spoke up to 250 languages with hundreds up dialects. Each clan is said to have had a certain spiritual connection with their specific piece of land that they lived on. However, they also traveled all across the country to trade, find water and seasonally farm. Later in the 17th century, many European explorers sailed the coasts of Australia, what was then known as New Holland. But not until 1770 did Captain James Cook claim the majority of the eastern side of the country for Britain. This new outpost was put to use as a "penal colony" and in January of 1788, the First Fleet of 11 ships arrived in the Sydney Harbour, carrying around 1,500 people, half of them convicts. A total of 160,000 men and women came to Australia as convicts until this penal transportation ended in 1868.(http://www.australia.com/about/culture-history/history.aspx) Many officers, soldiers and emancipated convicts had started to turn land they had received from the government into their own personal thriving farms. News of Australia’s cheap land and ample work was attracting more and more boats of curious and daring migrants from Britain. (http://www.aushistorytimeline.com/) Gold was soon discovered in New South Wales and central Victoria in 1851, attracting thousands of young men and women from the colonies and boat loads of prospectors from China. (http://www.australia.com/about/culture-history/history.aspx) Steadily, the population grew. In a few important decades, the entire continent was explored and Australia’s six states became a nation under one constitution on 1 January 1901. After the first war had ended in 1945, thousands of migrants from across Europe and the Middle East immigrated to Australia, many to find jobs in the booming manufacturing businesses. International demand grew for Australia’s major exports like metals, wools, meat and wheat. The rate of home ownership increased dramatically from only 40% in 1947 to over 70% by the 1960s. Today Australia is home to people from more than 200 countries. |
History of Australian Population & What it is Today
Higher population densities can be seen throughout the larger cities in Australia. Through the last reports, Australia was said to be the 3rd least densely populated country in the world. These figures are ABS estimates for the resident population, based on the 2001 and 2006 Censuses.

www.vidiani.com
www.anbg.gov.au
|
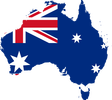
Population Pyramids

|
|
The population of Australia in the 1950's fluctuated with ages. Shown above in the left side picture, the majority of people were about 20-30 years old. There were many babies being born, but because of diseases and the lack of knowledge on how to treat these infections, many did not make it. Because of the net overseas migration (NET), Australia saw massive population growth in the early 2000s from people migrating. Australian population is projected to grow from a mere 9.962 million to 28.392 million in not even a century. All states and territories experienced massive population growth between the early 2000s to 2012. The Australian Bureau of Statistics stated that "areas that have seen decline include well-established suburbs within capital cities, and inland rural areas as can be seen in the following map which shows the population change of Statistical Areas Level 2 (SA2s) over this period. As seen in the images above, because of advances in modern medicine, Australians started to live to their nineties and above in 2012 rather than just breaching their eighties like in the 50's.
"Australian Bureau of StatisticsCelebrating the International Year of Statistics 2013." 3218.0. N.p., n.d. Web. 01 Oct. 2013. <http://www.abs.gov.au/ausstats/[email protected]/Products/3218.0~2012~Main Features~Main Features?OpenDocument>.
"Australian Bureau of StatisticsCelebrating the International Year of Statistics 2013." Animated Historical Population Chart. N.p., n.d. Web. 01 Oct. 2013. <http://www.abs.gov.au/websitedbs/d3310114.nsf/Home/Animated Historical Population Chart>.
"Australian Bureau of StatisticsCelebrating the International Year of Statistics 2013." 3105.0.65.001. N.p., n.d. Web. 01 Oct. 2013. <http://www.abs.gov.au/AUSSTATS/[email protected]/Lookup/3105.0.65.001Main Features12008>.
